Automation Strategy
5 Signs Your Warehouse Is Ready for Mobile Robotics
Aug 13, 2026 · 14 min read · Robotech Pros

Five operational signals that show your warehouse is ready for mobile robotics, with the metrics to check, realistic thresholds, and the next step for each score.
5 Signs Your Warehouse Is Ready for Mobile Robotics
Most mobile robotics projects that disappoint do not fail on the robot. They fail because the operation underneath the robot was not ready to absorb one. The fleet arrives, the pilot runs, the numbers come back ambiguous, and nobody can say with confidence whether the technology worked or the environment simply refused to cooperate.
Readiness is measurable. It shows up in labor data, in travel distance, in inventory accuracy, and in whether a single process can be isolated cleanly enough to test. Facilities that meet most of these conditions tend to see predictable results from autonomous mobile robots. Facilities that meet one or two usually spend the first six months fixing problems that had nothing to do with robotics.
Readiness Is an Operational Question, Not a Technology One
Interact Analysis forecasts the mobile robot market to grow at roughly 19 percent annually through 2030, reaching about 14 billion dollars, while fixed automation grows at about 2.4 percent. The 2026 MHI Annual Industry Report found 39 percent of supply chain leaders now rate robotics and automation as having a significant or greater impact on their operations, up 16 percentage points year over year.
That momentum makes it easy to treat this as a question of which system to buy. The harder question is whether your building, your data, and your processes can give a robot something consistent to work with. Every sign below is a proxy for that consistency.
Table 1: The Five Readiness Signs at a Glance
| Sign | What to Measure | Signal You Are Ready |
|---|---|---|
| 1. Labor volatility | Annual turnover and time to fill for pick, pack, and replenishment roles | Turnover above 40 percent, or open roles staying unfilled past 30 days |
| 2. Travel burden | Share of the picking shift spent moving between locations | Travel consuming roughly 40 percent or more of productive pick time |
| 3. Space pressure | Volume growth measured against usable floor area and clear height | Volume rising while expansion is blocked, delayed, or uneconomic |
| 4. Data quality | Location-level inventory accuracy and task-level order data | Accuracy at or above 98 percent by location, with a live system of record |
| 5. Process fit | Existence of a repeatable, bounded task with stable volume | At least one workflow you could isolate and pilot within 90 days |
The signs are cumulative rather than independent. Meeting three or more usually indicates a facility that can absorb mobile robotics without a disruptive redesign.
Sign 1: Your Labor Plan Depends on People You Cannot Reliably Hire
Warehouse labor has not become dramatically easier to secure, even as the broader quits rate has cooled. Bureau of Labor Statistics data put the 2025 annual average quits rate for transportation, warehousing, and utilities at 2.2 percent per month, which compounds into meaningful annual churn for facilities that sit above the sector average.
The number that matters is not turnover on its own. It is what turnover does to your throughput plan. If you budget 40 pickers and routinely operate with 33, the gap gets absorbed by overtime, by temporary staff who need retraining every peak, or by service levels quietly slipping. Mobile robotics does not remove people from that equation. It reduces how much of your throughput depends on the least predictable part of your staffing model.
Sign 2: Travel Time Is Eating a Measurable Share of Your Pick Hours
The standard order picking time breakdown used across warehouse design literature allocates roughly 50 percent of picker time to travel, 20 percent to searching, 15 percent to extracting, 10 percent to setup, and 5 percent to everything else. Travel is almost always the largest single component, and it is the component that adds no value to the order.
Most operations have never measured it directly. They know lines per hour. They do not know how many miles a picker covers in a shift, or how much of that distance is spent returning to a pack station. Both numbers are usually recoverable from WMS task history.
Once travel crosses roughly 40 percent of productive pick time, the case for AMR and AGV systems becomes arithmetic rather than aspirational. You are paying labor rates for movement, and movement is the one task a mobile robot performs without fatigue, without variance, and without a shift differential.
Table 2: Labor and Travel Diagnostics Worth Running First
| Metric | Where the Data Lives | What the Number Tells You |
|---|---|---|
| Annual turnover rate | HRIS or staffing agency reporting | Above 40 percent means training cost recurs and process knowledge never accumulates |
| Temporary labor share at peak | Payroll and agency invoices | Above 25 percent signals a variable cost base that automation can flatten |
| Lines picked per labor hour | WMS labor reporting | A flat rate despite rising tenure points to a process constraint, not a people problem |
| Travel distance per picker per shift | WMS task history or a manual time study | Above six miles per shift indicates travel dominates the cost of the pick |
| Overtime as a share of total hours | Payroll | Sustained overtime above 10 percent usually means you are already past your labor ceiling |
Measure across a normal four-week period rather than a peak week, so the baseline reflects steady-state conditions instead of seasonal distortion.
Sign 3: Volume Is Growing Faster Than the Building Can Expand
Space pressure is one of the clearest readiness signals because it removes the easiest alternative. When a facility can add square footage cheaply, adding square footage almost always wins on a spreadsheet. When it cannot, density and throughput per square foot become the only available levers.
Common indicators include aisles narrowed to the practical limit, staging areas absorbing overflow inventory, a lease with years remaining, or a network study that concluded a new building costs more than the volume justifies.
This is the situation where a brownfield retrofit tends to outperform a greenfield build on both timeline and capital. Mobile robotics is comparatively tolerant of existing layouts, because the fleet routes around the building rather than requiring the building to be rebuilt around fixed conveyance.
Sign 4: Your Inventory and Order Data Are Accurate Enough to Act On
This is the sign most often skipped, and the one most likely to sink a pilot. A picker who arrives at an empty location adapts. They check the next slot or radio a supervisor. A robot executes the task it was given and reports an exception.
Data quality that a manual operation tolerates becomes a throughput ceiling once robots are introduced. Location-level accuracy below roughly 98 percent produces enough exceptions to erase the labor savings the fleet was bought to deliver, and accuracy tracked only at SKU level hides exactly the location errors that matter.
The system side matters equally. Your WMS or WES needs to release discrete, timestamped tasks, and it needs an integration path that your vendor licensing actually permits. Confirming both early is a normal part of warehouse systems integration scoping, and it is far cheaper to discover a licensing block during evaluation than during commissioning.
Table 3: Data, Systems, and Facility Readiness Checklist
| Readiness Area | Minimum Condition | Common Gap |
|---|---|---|
| Inventory accuracy | 98 percent or better at location level, verified by cycle count | Accuracy tracked at SKU level only, which conceals location errors |
| System of record | A WMS or WES that releases discrete, timestamped tasks | Order flow managed in spreadsheets or an ERP without task granularity |
| Integration path | Documented API or middleware access to the WMS | Vendor licensing that blocks third-party task exchange |
| Network coverage | Continuous wireless coverage across every travel path | Dead zones at dock doors, inside racking canyons, and near freezers |
| Floor condition | Level floors, marked travel lanes, no permanent obstructions | Staged pallets and equipment parked in aisles as accepted practice |
| Change ownership | A single named internal owner with decision authority | Responsibility split between operations and IT with no tiebreaker |
Data and network gaps are usually cheaper to close than facility gaps, and closing them first materially improves the quality of any pilot that follows.
Sign 5: You Have One Bounded Process You Could Pilot in 90 Days
Readiness in one area is not readiness everywhere. The strongest first deployments have at least one workflow that is repeatable, measurable, and separable from the rest of the operation: replenishment from bulk to forward pick, tote transport between pick zones and pack, finished goods movement from line-side to staging, or returns transport to processing.
A bounded process gives a pilot a clean answer. You define the throughput target, the accuracy threshold, and the exception rate in advance, then measure against them. Without that boundary, results get attributed to whatever the loudest stakeholder believed going in. This is also the point where the financial model should be built rather than assumed. Working through warehouse automation ROI on a single defined workflow produces a far more defensible number than modeling the whole facility at once.
Scoring Your Readiness
Count a sign as met only if you have measured it. Assumed readiness is the single most common reason pilots produce inconclusive results, because the assumption that failed is rarely the one anyone was watching.
Table 4: Readiness Scorecard and Recommended Next Step
| Signs Met | Readiness Level | Recommended Next Step |
|---|---|---|
| 0 to 1 | Not yet | Fix inventory accuracy and start measuring labor and travel before evaluating vendors |
| 2 | Early | Run a workflow study to find where travel and labor cost actually concentrate |
| 3 | Approaching | Scope a single process pilot and write the acceptance criteria before vendor conversations |
| 4 | Ready | Move to a proof of concept with defined throughput, accuracy, and exception targets |
| 5 | Ready and time sensitive | Plan a phased rollout with a fleet management and orchestration path built in from the start |
Scores of 3 and above generally justify a funded pilot. Scores below 3 are better served by six to twelve weeks of measurement and data remediation first.
If You Scored Lower Than Expected
A low score is useful information, not a verdict. Most of these gaps are correctable within a quarter, and closing them improves the operation whether or not robotics follows. What a low score should prevent is a full-scale deployment built on an unmeasured foundation, because the cost of discovering the gap during commissioning is considerably higher than the cost of finding it now.
Where to Start
If three or more of these signs describe your facility, the next step is not a vendor demonstration. It is a structured look at which workflow carries the most avoidable travel and labor cost, and what it would take to test that workflow under real conditions. A scoped proof of concept answers the investment question on one process, with defined targets, before capital is committed across the building.
Robotech Pros runs that assessment against your own operating data. If you want a second read on where your facility stands today, we can walk the five signs through your numbers.
Related resources

Scaling From 5 Robots to 50: What Breaks When Your Fleet Grows
Operations directors, warehouse general managers, and automation program leads in North America
-2.png&w=1080&q=75)
What Is Robotics-as-a-Service (RaaS) and Does It Make Sense for Your Operation?
RaaS shifts robotics from capex to a subscription. Here is how the models differ, where RaaS fits, and the contract terms to check before signing.
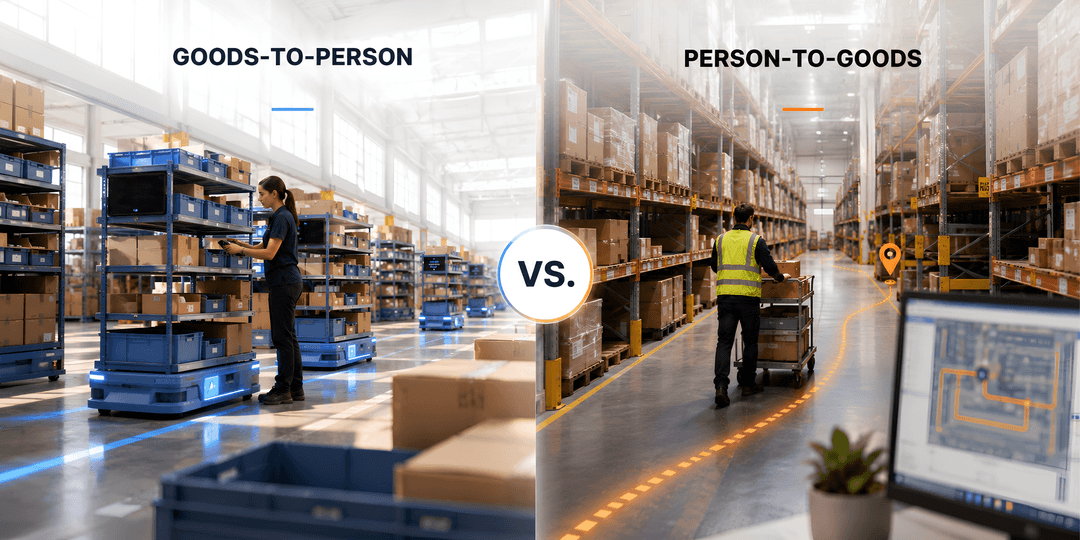
Goods-to-Person vs. Person-to-Goods: Which Model Fits?
Compare goods-to-person and person-to-goods fulfillment on throughput, cost, density, and flexibility, and see which model fits your warehouse.